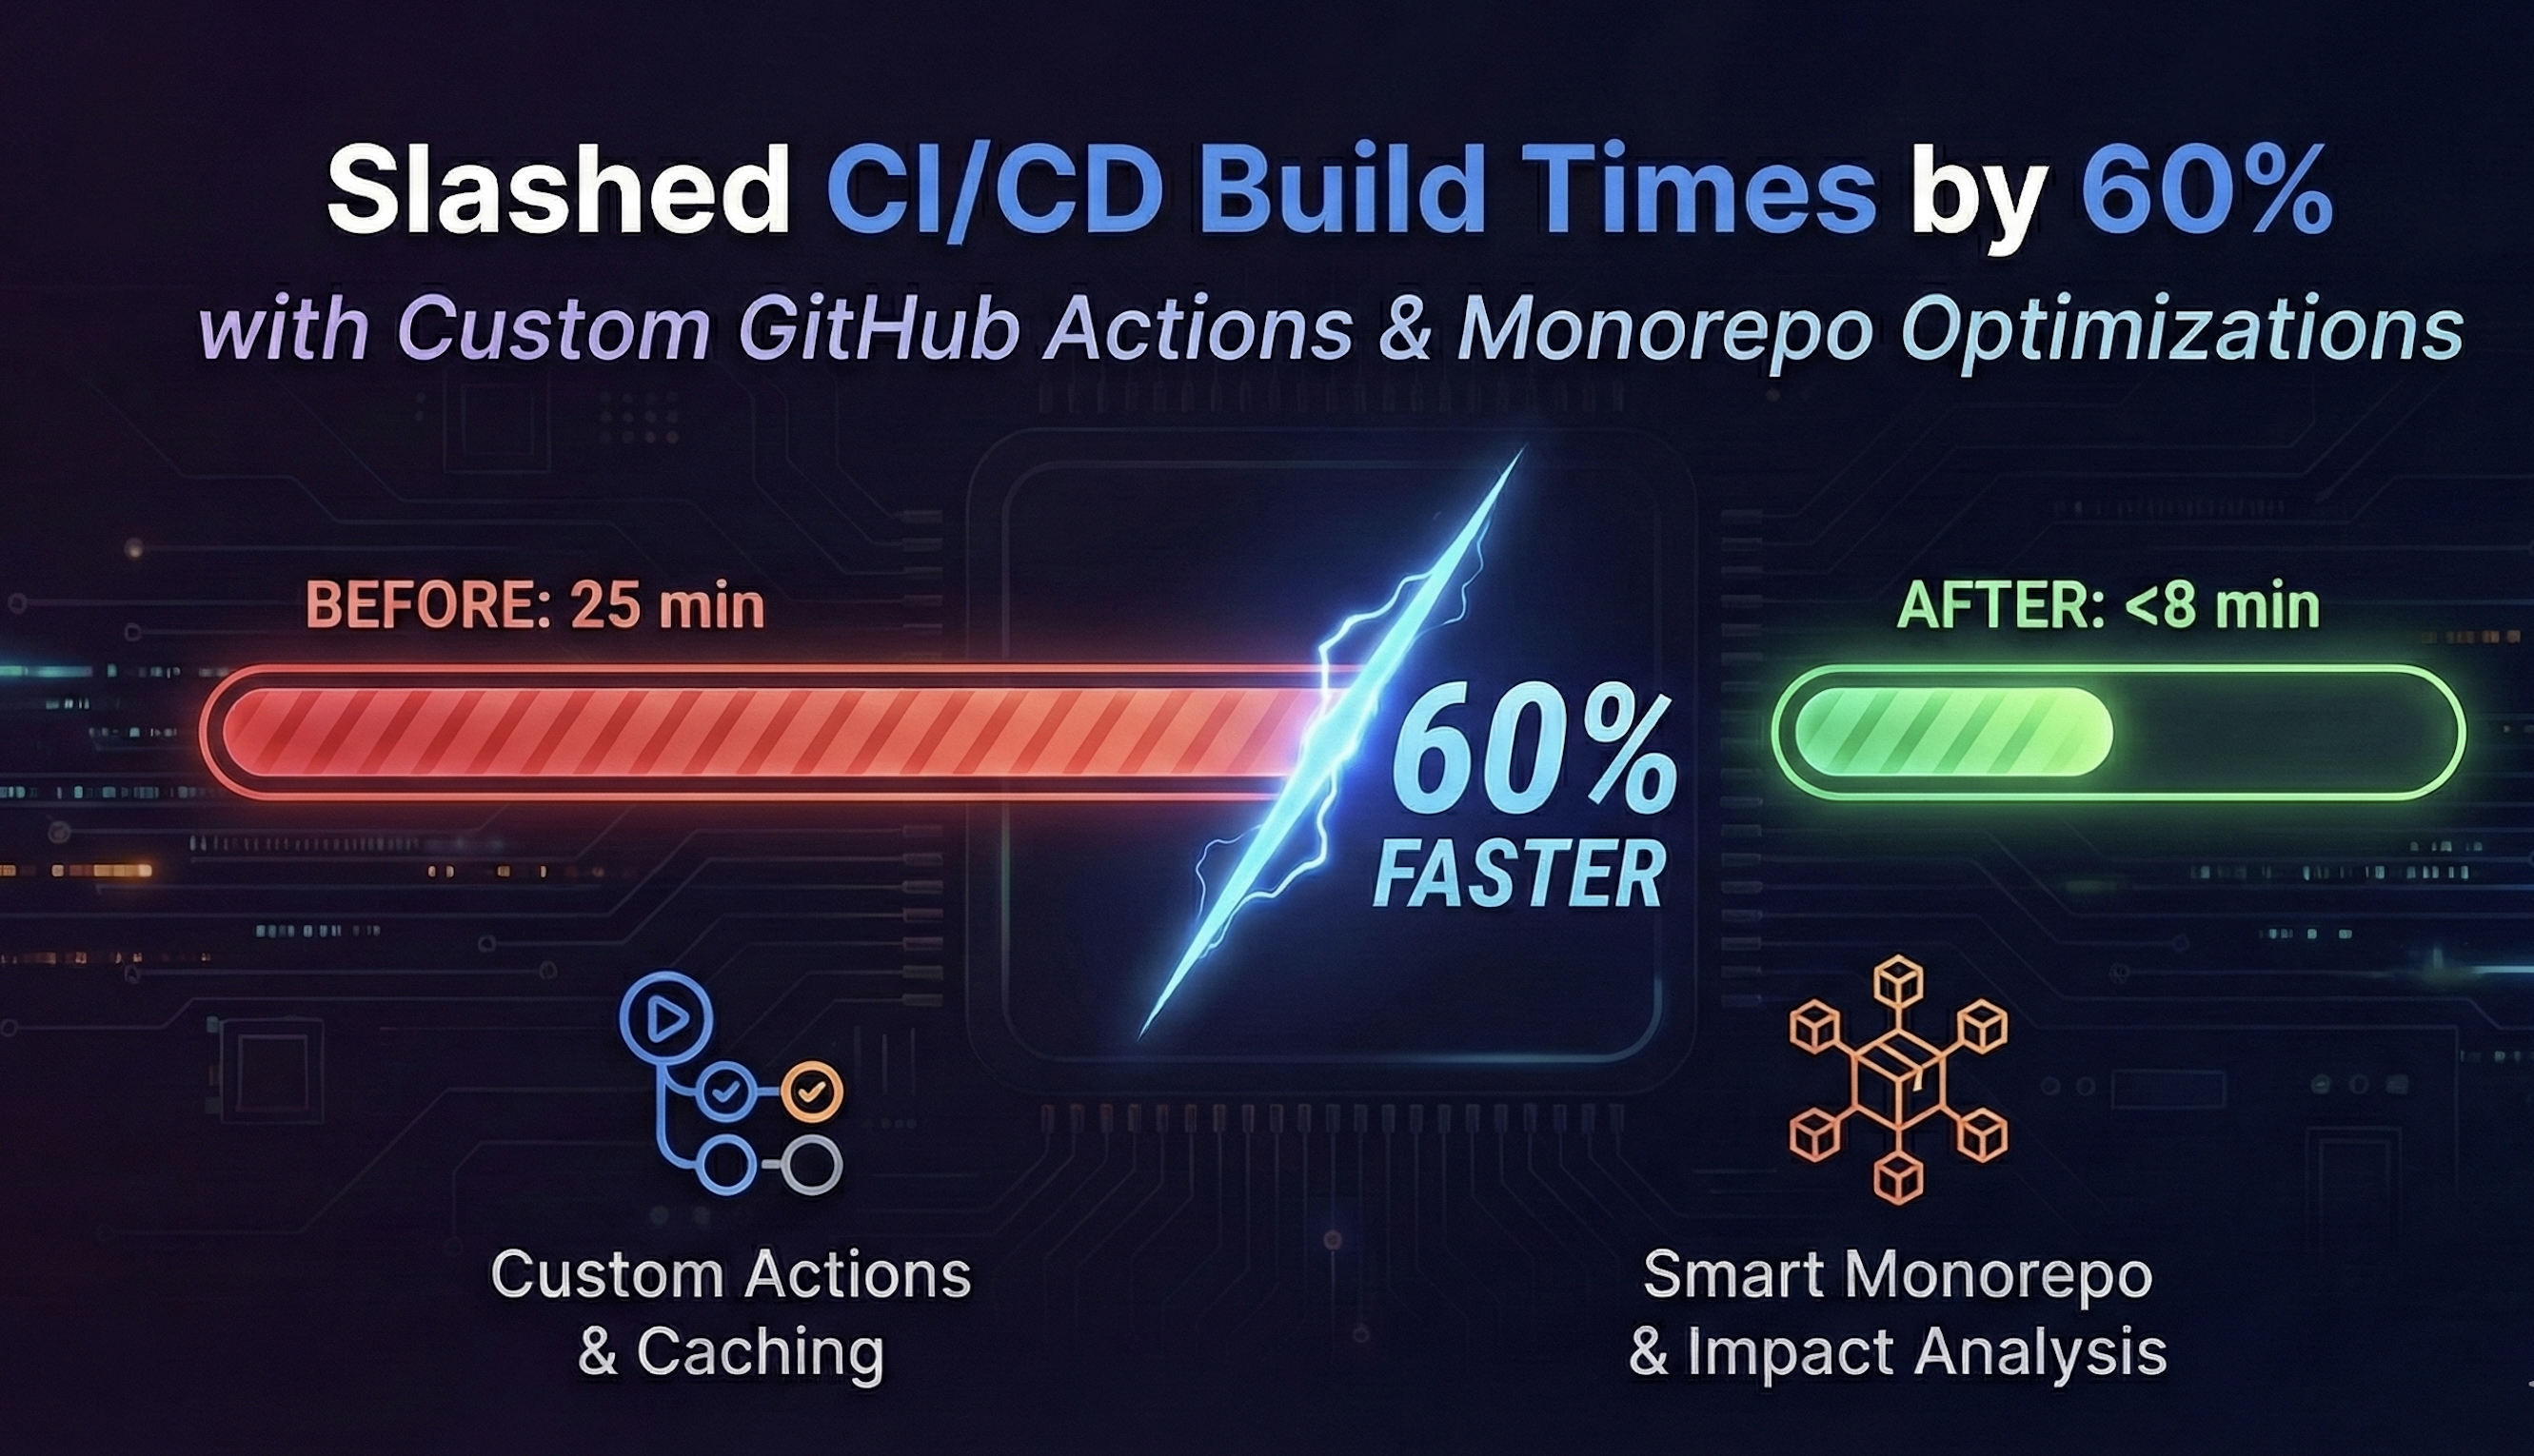
How We Slashed CI/CD Build Times by 60% with Custom GitHub Actions.

Rishav Sinha
Published on · 5 min read

The Bottleneck: Waiting 25 Minutes for a Typo Fix
We hit a breaking point. Our engineering team had grown to 20+ developers working in a TypeScript monorepo containing three Next.js frontends, two Node.js services, and a shared UI library. The feedback loop was excruciating.
Deploying a single line of CSS change triggered a 25-minute CI pipeline.
Developers were context-switching while waiting for checks to pass, leading to broken flow states and a massive backlog of PRs on Fridays. We were also burning through our GitHub Actions minutes budget at an alarming rate. We needed to treat our CI pipeline like a product, not an afterthought.
The "Naive" Approach: Run All The Things
In the early days, like many startups, we opted for simplicity. Our .github/workflows/ci.yml was a brute-force instrument. If a developer pushed code, we ran npm install, npm test, npm run lint, and npm run build on everything.
This works fine when you have 50 files. It is disastrous at scale.
Why this fails:
- Redundant Compute: Touching the
marketing-siteshouldn't trigger tests for thebackend-api. - No Layer Caching: We were downloading the same 800MB of
node_moduleson every single run. - Linear Execution: Jobs were running sequentially rather than leveraging the inherent parallelism of the graph.
The Architecture: Smart Monorepos and Composite Actions
To cut build times by 60% (from ~25m to ~8m), we moved to an architecture centered around Impact Analysis and Remote Caching.
We stuck with Turborepo for the orchestration because of its hashing algorithm, but the real magic happened in how we integrated it with GitHub Actions.
The Strategy:
- Composite Actions: We abstracted our setup logic (Node install, pnpm setup, cache restoration) into a local composite action to ensure consistency across jobs.
- Remote Caching: We connected Turbo to a remote cache artifact store (Vercel or self-hosted). If a hash matches, the build is skipped entirely, and artifacts are downloaded in seconds.
- Affected Graph: We configured the CI to only run tasks against packages that actually changed (compared to
main).

The Implementation (Deep Work)
Let's look at the configuration. The biggest win came from standardizing our environment setup to maximize cache hit rates.
First, we created a Composite Action. This reduces code duplication in your workflows and allows you to centralize the logic for caching pnpm stores.
# .github/actions/setup-node-pnpm/action.yml
name: "Setup Node & PNPM"
description: "Sets up Node.js, pnpm, and handles strict caching strategies"

inputs:
  node-version:
    description: "Node version to use"
    required: false
    default: "20"

runs:
  using: "composite"
  steps:
    - name: Setup Node.js
      uses: actions/setup-node@v4
      with:
        node-version: ${{ inputs.node-version }}

    - name: Install pnpm
      uses: pnpm/action-setup@v2
      with:
        version: 9.0.0
        run_install: false

    - name: Get pnpm store directory
      id: pnpm-cache
      shell: bash
      run: |
        echo "STORE_PATH=$(pnpm store path --silent)" >> $GITHUB_OUTPUT

    # SENIOR TIP: Hash the lockfile strictly. If lockfile hasn't changed,
    # restoring modules takes seconds instead of minutes.
    - name: Setup pnpm cache
      uses: actions/cache@v4
      with:
        path: ${{ steps.pnpm-cache.outputs.STORE_PATH }}
        key: ${{ runner.os }}-pnpm-store-${{ hashFiles('**/pnpm-lock.yaml') }}
        restore-keys: |
          ${{ runner.os }}-pnpm-store-

    - name: Install dependencies
      shell: bash
      run: pnpm install --frozen-lockfile
Next, the Turbo Configuration. You must define your pipeline strictly so Turbo knows that build depends on ^build.
// turbo.json
{
  "$schema": "https://turbo.build/schema.json",
  "pipeline": {
    "build": {
      // "outputs" is CRITICAL for caching.
      // If these files exist, Turbo skips the task.
      "outputs": ["dist/**", ".next/**", "!.next/cache/**"],
      "dependsOn": ["^build"]
    },
    "test": {
      "dependsOn": ["build"],
      "inputs": ["src/**/*.tsx", "src/**/*.ts", "test/**/*.ts"]
    },
    "lint": {}
  }
}
Finally, the Main Workflow. We use the --filter flag here. Note the use of concurrency to cancel outdated builds, this alone saves significant cost.
# .github/workflows/ci.yml
name: CI

on:
  push:
    branches: ["main"]
  pull_request:
    types: [opened, synchronize, reopened]

concurrency:
  group: ${{ github.workflow }}-${{ github.ref }}
  cancel-in-progress: true

jobs:
  quality:
    name: Quality Checks
    runs-on: ubuntu-latest
    steps:
      - name: Checkout Repo
        uses: actions/checkout@v4
        with:
          fetch-depth: 0

      - name: Setup Environment
        uses: ./.github/actions/setup-node-pnpm

      - name: Lint & Test Affected
        run: pnpm turbo run lint test --filter="[origin/main...HEAD]"

  build:
    name: Build Affected
    runs-on: ubuntu-latest
    needs: quality
    steps:
      - name: Checkout Repo
        uses: actions/checkout@v4
        with:
          fetch-depth: 0

      - name: Setup Environment
        uses: ./.github/actions/setup-node-pnpm

      # If the artifacts are in the remote cache, this step takes ~10 seconds
      - name: Build
        run: pnpm turbo run build --filter="[origin/main...HEAD]"
        env:
          # Ensure you have your remote cache credentials set in GitHub Secrets
          TURBO_TOKEN: ${{ secrets.TURBO_TOKEN }}
          TURBO_TEAM: ${{ secrets.TURBO_TEAM }}
The "Gotchas":
Optimizing CI is never as clean as the tutorials make it look. We ran into two specific issues that caused headaches:
-
The "Fetch Depth" Trap: Initially,
turbo --filterwas returning empty lists or failing entirely. It turns outactions/checkoutdefaults tofetch-depth: 1ie shallow clone. Turborepo needs the git history to compare the current HEAD againstorigin/main. Always setfetch-depth: 0if you are doing diff-based execution. -
Next.js Cache Bloat: We tried to cache the
.next/cachefolder to speed up subsequent builds. However, the cache grew to over 3GB, and the time spent downloading and unzipping the cache from GitHub Actions storage took longer than just rebuilding the app. We optimized this by excluding bulky static assets and only caching the specific Webpack build traces.

Conclusion
By moving to a smart monorepo structure and leveraging composite actions, we reduced our average build time from 25 minutes to roughly 8 minutes. On a good day, with high cache hit rates, it's under 3 minutes.
The takeaway when CI gets out of the way, engineers ship faster and break things less often. Stop letting your pipeline be the bottleneck.